December 13, 2018

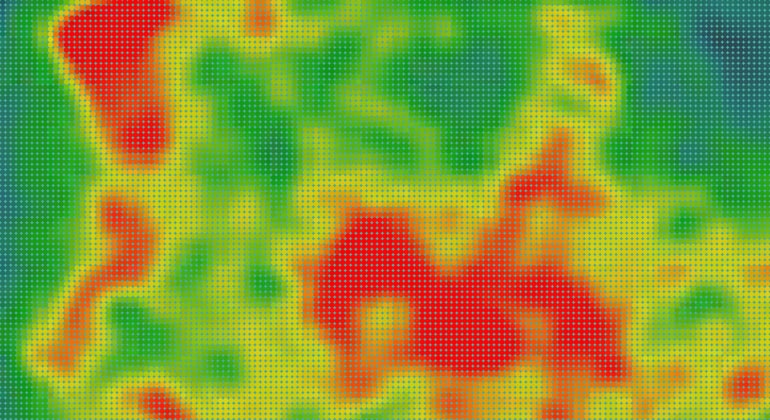
Heat mapping is growing in popularity as companies continue to look for new insights into the user’s journey. While tools like Google Analytics provide multiple metrics into page visits and bounce rates, they still don’t offer up a clear answer as to how users interacted with a specific page. Heat maps that reflect the intensity of a user's eye and mouse movement across a certain page give a quick, visual look into their behavior. After all, when it comes to analyzing the user journey, a picture can be worth a thousand words.
Today there are many different tools and technologies for tracking this type of behavior, which provides compelling insights. The main advantage of these tools are that they collect real-time, spontaneous user reactions in an unobtrusive manner. With unbiased data, you gain a better understanding of consumer behavior across your site and can uncover new ways to improve user experience and engagement.
Here’s 4 common heat mapping tools and their unique benefits.
1. Eye-Tracking
This method tracks a user's visual path across a web page, including their blink frequency and pupil diameter. The tools could be either remote or head-mounted to a computer, usually consisting of a light source and camera. Paired together with eye-tracking analysis software, you’re able to determine what pictures are seen, what specific features catch someone’s attention, how fast their eyes are moving across the page, and most importantly what content is overlooked.
Some tools such as EyeTracker’s Index of Cognitive Ability (ICA) even measure the mental workload of a participant. This means you’re able to see the mental effort someone puts forth when navigating your website, which lets you determine what areas of your site may be too difficult or confusing.
2. Mouse-Movement
This type of tracking tool shows the mouse movement of all visitors on your website. This means you’ll see what areas users hover over, indicating which content draws the most attention. It also gives valuable insights into movement patterns across your site and can help you trace any differences that may exist between visitors who convert and ones that don’t.
Mouse-tracking is a cheaper alternative to eye-tracking technology, since the results and information delivered are typically very similar. It also gives a larger sample size, taking into account every user on your site. However, a drawback is that in this case there’s no pre-defined tests or visitor feedback.
3. Click and Scroll Maps
Unlike Google Analytics, a click map doesn’t just show what links are clicked, but every area where the user clicks. For example, is there a picture visitors keep clicking on expecting a link? Or maybe there’s a button that looks like it should take them to another page but doesn’t. Obtaining this data can help you greatly improve the user experience, eliminating any frustration or confusion.
Scroll maps are typically used in conjunction with click maps and eye-tracking, letting you see at which points users scroll or abandon a page. Depending on the software, they can also include valuable analytics like the percentage of users who abandon the page at different points. Utilizing these tools while A/B testing is a powerful strategy to maximize effectiveness.
4. Form Analytics
Your form structure and content can make all the difference when it comes to converting visitors. Utilizing various elements of the tools listed above, form analytic tools help you identify what areas on your form cause the most friction and visitor abandonment. This can include data regarding which fields people are hesitant to fill in, which fields cause the most error messages and how long it takes people to fill out the entire form.
Each of these heat-mapping tools, especially when paired together, gives you invaluable insights for how visitors authentically interact and react to your site.